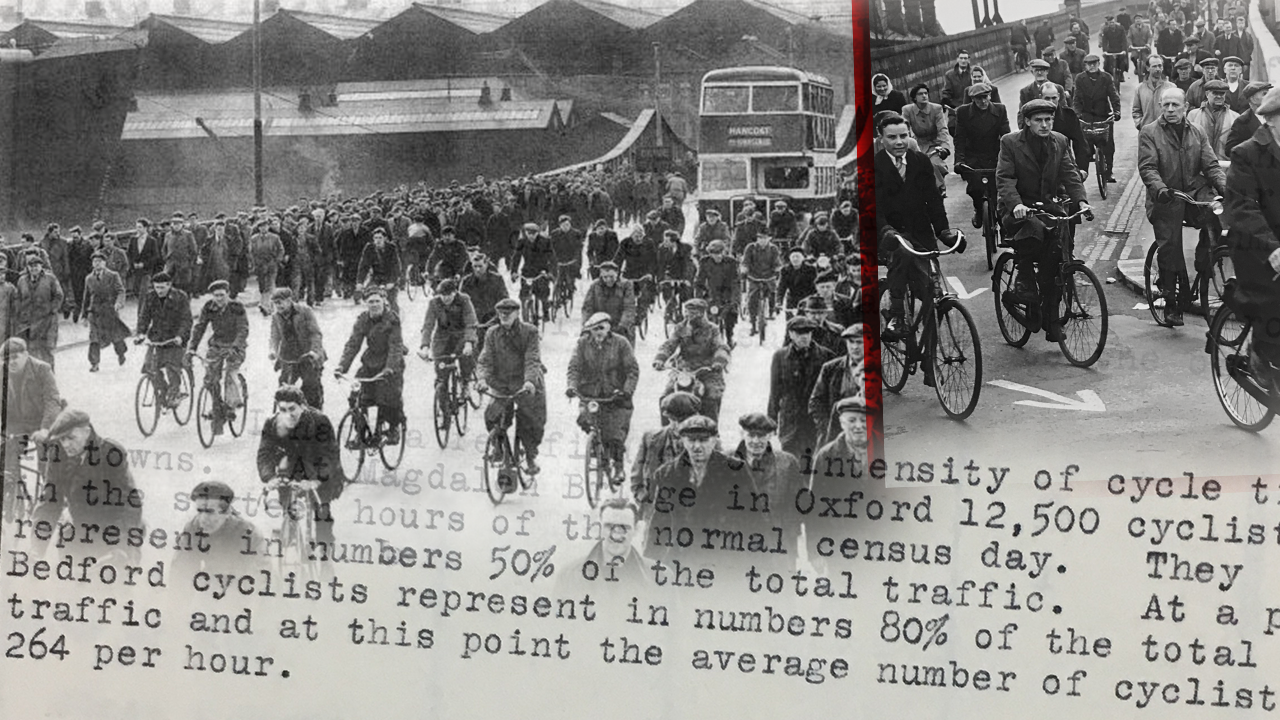
Cycling boomed in Britain during the 1930s, bamboozling officialdom and annoying motorists. For several years, cyclists “swarmed” over major roads and dominated the streets of many cities.
Cycle use was so high in some English cities that one town planner described cyclists as “locusts.” Thomas Sharp, the author of Town Planning, a Pelican Book that sold 250,000 copies in 1940, was describing postwar Oxford, but his comment that “the bicycle … is one of the main causes of traffic congestion” would have been true of the war years, too, when cycling was both commonplace and necessary.
We may consider the bicycle to be benign; Sharp did not. He called it “the new and dangerous invention of the [eighteen-] eighties…” He went on: “Bicycles came in hordes, like locusts, upon the university towns… The bicycle … is one of the main causes of traffic congestion… [They] cannot be lightly dismissed as mere bicycles. A few locusts are of little importance. A swarm is a plague.”
Cyclists dominated the roads of many British towns and cities, and were blamed for “holding up” motorists.
“The cycle traffic on the Wolverton Road [near Stoney Stratford in Buckinghamshire] represents in numbers 54 percent of the traffic on the road throughout the day,” reported an MoT official in 1935, adding that “at rush hours it reaches 80 percent of the total traffic using the road.”
The same was true for Bedford, added the official, where “cyclists represent in numbers 80 percent of the total daily traffic.”
At Magdalen Bridge in Oxford, 12,500 cyclists pass in the sixteen hours of the normal census day. They represent in numbers 50 percent of the total traffic. At a point in Bedford cyclists represent in numbers 80 percent of the total daily traffic …
A 1935 MoT census listed 65 trunk roads where cyclists outnumbered motorists. On the northern approach to the Tees bridge near Middlesbrough the Ministry counted 1,839 motor vehicles, but 4,907 pedal cycles. On the A1086 at Hartlepool there were 644 motor vehicles and yet 2,150 cyclists. Between Leigh and Pendlebury, at the junction between the A579 and the A574, there were 2,002 motor vehicles and 3,343 cyclists.
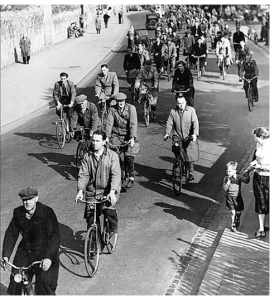
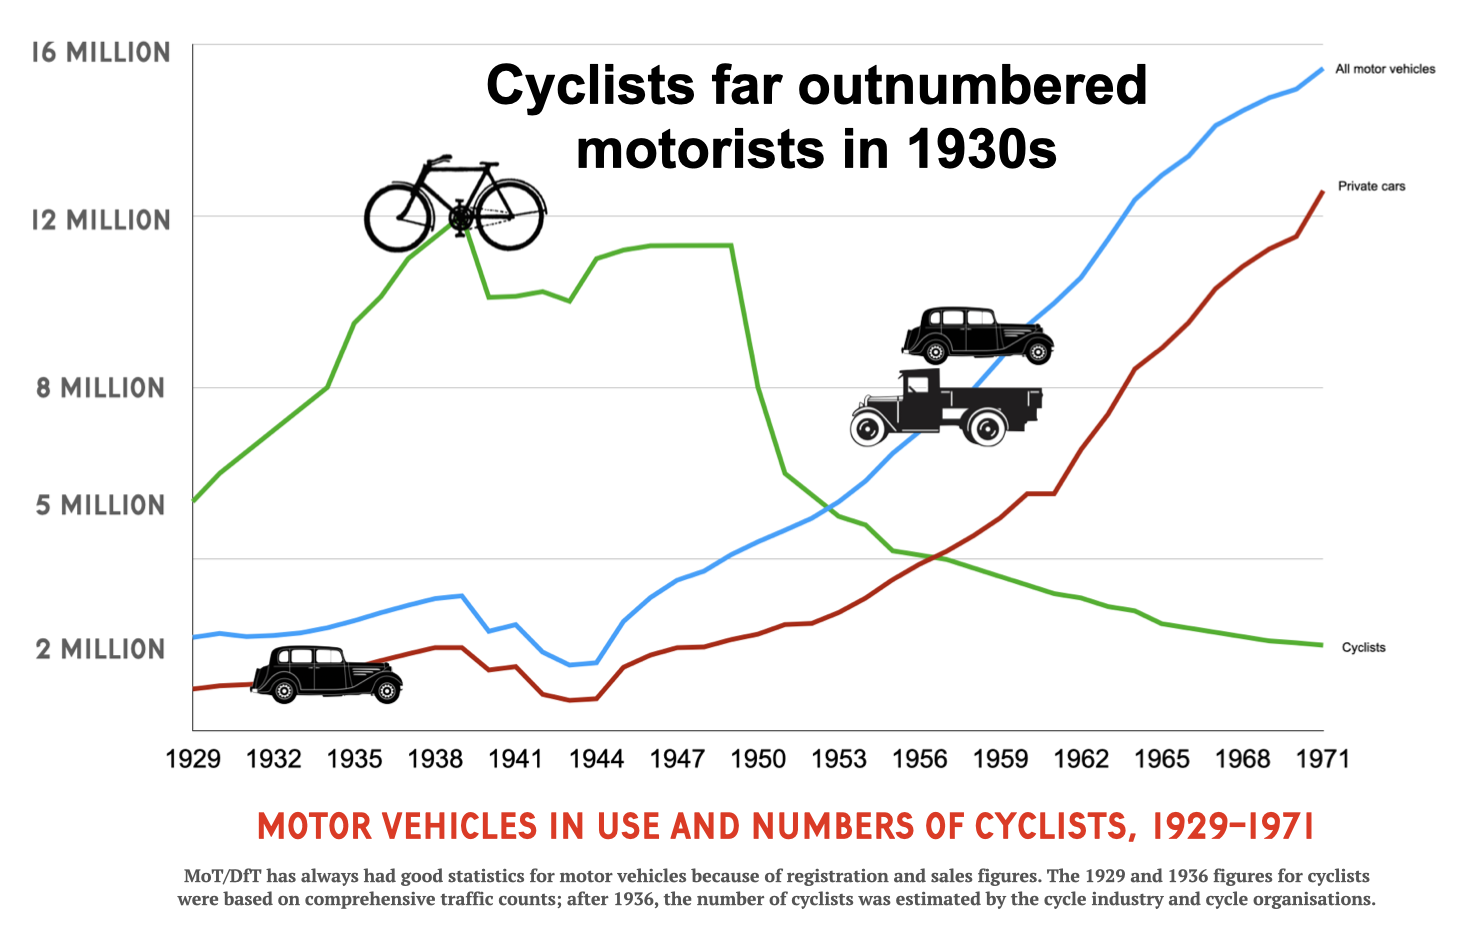
The huge increase in the number of cyclists did not go unnoticed by motoring organisations. “In the class 2 roads census taken in 1936, the aggregate number of pedal cycles … was 10,123,000 compared with 5,343,000 in 1929,” Professor Raymond Clements, chairman of the RAC’s roads and traffic committee told the 1938-1939 Select Committee of the House of Lords on the Prevention of Road Accidents, which published what became known as the Alness report.
Traditionally, historians usually only report on the rise in private motor car usage during the 1930s but, in fact, this usage was far less steep than that for cyclists. Between 1928 and 1938 there was an increase of 103 percent, from 884,645 to 1,798,105 motor cars, the professor told the peers on the committee, but this was dwarfed by the increase in cyclists, he added.
“The census of pedal cycles is the most startling,” admitted Clements.
“These are very arresting, if not staggering figures?” suggested committee chair Lord Alness.
“They are indeed,” replied Clements, “those are the most impressive of all, I think.”
The numbers of cyclists on major roads later fitted with cycle tracks increased significantly in the 1930s — the average number of cyclists on Western Avenue at one point increased from 1,772 in 1931 to 6,515 in 1935 Statistics from the MoT’s summer 1936 traffic census showed cyclists far outnumbering motorists in Greenford: 1,451 cars were counted, and 4,246 cyclists.

“Daily traffic movements show that the early morning and the evening are peak periods for cyclists going to and from work,” reported The Scotsman in 1936.
Writing to the MoT’s chief engineer in March 1936 with traffic census data, the ministry’s northern divisional road engineer, said there had been an “extraordinary increase [of cyclists] between the censuses of 1931 and 1935 ranging from 169 per cent to 388 per cent.”
On Class 1 major roads there were 65 points where the average number of cyclists per day was greater than average number of motor vehicles per day, he reported. See table below, which shows that on some major northern roads there could be twice as many people on bicycles as cars.
| CLASS 1 MAJOR ROAD | MOTOR VEHICLES | CYCLISTS |
|---|---|---|
| East Hessle Village, Yorkshire | 1146 | 2535 |
| Leeds-Selby-Hull (Alfred Gelder Street) | 6243 | 9803 |
| Leeds-York (west of A19) | 6279 | 7288 |
| Leeds-Pontefract | 3148 | 4071 |
| West Hartlepool-Bishop Auckland (Stockton Street, between A176 and B1271) | 2125 | 4588 |
| Broomhaugh-Tynemouth (between Wallsend and S. Shields) | 1109 | 1432 |
| Doncaster-York (Selby Bridge) | 1335 | 1883 |
| Middlesbrough-Normanby (Normanby mid-A1085-A174) | 859 | 1659 |
| Wheatlands-Redcar (Cemetery Lane, Redcar) | 1510 | 2488 |
| Stockton-Port Clarence (West Haverton Hill) | 1992 | 3854 |
| Hart-Hartlepool (3/4 mile east of A1086) | 644 | 2150 |
| Tees-(Newport) Bridge & Approaches | 1839 | 4907 |
| Liverpool-Litherland (Orrell) | 2651 | 3305 |
| Seaforth-Maghull (Seaforth) | 1512 | 2448 |
Commercial motor vehicles increased by 45 percent in this period and passenger vehicles by 43 percent. The rise in the number of cyclists was 301.2 per cent in Preston, Lancashire, reported The Cyclist in September 1936.
County council highways committees reported on the significant increase in cycle numbers in their areas. Here’s the traffic census carried out over seven days in August 1936 in Nottingham:
| URBAN B ROAD | MOTOR VEHICLES | CYCLISTS |
|---|---|---|
| B6006 Wollaton Road | 9199 | 17,765 |
| B6464 Chilwell Road | 15,541 | 18,413 |
| B6004 Hickings Lane | 3454 | 3970 |
Cyclist numbers increased throughout the 1930s. “Many [census] enumerators were obliged to ask for extra sheets to fill in the number of cyclists,” remarked an MoT official after the 1938 traffic census.
Reporting on the huge uplift in cycle usage the motoring correspondent of a Scottish newspaper in effect said that this increase meant cyclists ought to get less space on roads.
“The results of the Road Traffic Census … confirm[s] what every motorist broadly knows already — that pedal cyclists have increased enormously within the past few years,” wrote the correspondent in September 1936.
“[The] great increases, both in pedal cycles and in commercial vehicles, must lead to important modifications in the construction of new roads and the reconstruction of existing roads,” he continued.
“My own belief is that the increase of 95 percent in pedal cycles is only a beginning, and that the number of pedal cyclists will increase still more as the motor car population increases,” he added, suggesting that “special accommodation on the roads” should be found for the greatly increased number of cyclists otherwise a “state of great congestion is inevitable.”
That a greatly increased number of road users should be squeezed into reduced space was ridiculed by the Daily Herald’s long-time cycling correspondent, William Fitzwater Wray. Cyclists, he wrote in September 1936, “have shocked [transport minister] Mr. Hore-Belisha by daring to double their numbers in five years.”
“As a greater proportion of the nation takes to the roads [as cyclists],” he remarked, “more room must be provided.” Instead, he complained, “the largest section of road-users shall have much less room than before.”

NOTES
[1] Today, there are more bicycles than motor vehicles on some A-roads, according to Department for Transport figures.
Cyclists account for 87 percent of traffic on a section of Lambeth Road and 81 percent on Royal Mint Street in the City.
On the High Street outside Magdalen College, Oxford, which is an A-road, an average of 14,700 cyclists pass daily, compared with 11,700 motor vehicles.
The average number of cyclists has grown tenfold in central London during the last 20 years.
[2] He went on: “Bicycles came in hordes, like locusts – Thomas Sharp, Oxford Replanned, 1948.
[3] To the MoT’s chief engineer, from Divisional Road Engineer, Eastern Division, May 2, 1935
[4] Traffic Census of Class One Roads, 1935. List of the 65 Census points where Average Number of Pedal Cycles per day is greater than Average Number of Vehicles per day, Ministry of Transport archives, National Archives.
[5] “Cycle Census – Great West Road”, September 18, 1937, Ministry of Transport. (See: CYCLE TRACKS: Proposed construction, 1926-1943, Ministry of Transport, MT 39/127, National Archives, London.)
[6] TRAFFIC CENSUS
CLASS II ROADS
Greenford U. (Ealing B. 1936)
¼ m. E. of Junction with A, 4127
August 1929: 712 cars; 886 pedal cycles
August 1936: 1451 cars; 4246 pedal cycles
====
Strood R.D.C, (Gravesend R. 1936)
Old Road East — East of Abbey Road
Junction with A/226
August 1929: 359 cars; 381 pedal cycles
August 1936: 671 cars; 1387 pedal cycles
====
South Mimms R. (Potters Bar U. 1936)
1 mile W. of A.1., near Manor Farm.
August 1929: 716 cars; 473 pedal cycles
August 1936: 1465 cars; 1423 pedal cycles
====
Staines R•D. (Urban 1936)
¼ m. South of Route A/30.
August 1929: 394 cars; 854 pedal cycles
August 1936: 762 cars; 2051 pedal cycles
=====
Twickenham Borough
At Hospital Bridge
August 1929: 298 cars; 913 pedal cycles
August 1936: 1043 cars; 2168 pedal cycles
====
The Ministry of Transport carried out a traffic census at 5,000 points throughout the UK during the week of August 12-18, 1936. MT44/14
[7] The Scotsman, 3 September 1936.
[8] Memo from Mr. Richmond (?), Divisional Road Engineer, Northern, to Chief Engineer, Ministry of Transport, 23rd March 1936.
[9] The Bicycle, September 8th, 1936
[10] The Cyclist, September 9th, 1936
[11] Highways and Lighting Committee, 15 September 1936, Nottinghamshire County Council
[12] BRITAIN’S ROAD SENTRIES TO TAKE A REST.
The myriads of figures gleaned road sentries during the traffic census on Britain’s 4,500 miles of trunk highways—completed last week —are now being collated by the authorities. Then they will look for the morals. This census —the first of four quarterly accounts —is part of the Ministry of Transport’s campaign to make Britain’s roads safer. For week hundreds of enumerators had been at posts, night and day, at busy crossroads, and along isolated stretches. These sharp-eyed observers noted ’buses and bicycles, pantechnicons and pedestrians and lorries and limousines. They made millions of little strokes or dots, and concentrated was their work that many of them must be still seeing spots before the eyes. Provision was made for them to be comfortable as possible at their tasks and they relieved each other at eight hour intervals. For the first time, women helped in the work. With pencils poised, these sentries of the road were housed in little shelters—something like sentry boxes—and nothing was permitted to escape their notice on the roads. Although it too early yet to give any figures, one surprise is likely to be in the number of cyclists on the roads. Many enumerators were obliged to ask for extra sheets to fill in the number of cyclists,” said an official. The real task of dealing with the work of the census does not begin until the sheets of the enumerators have all been sent in.
Shepton Mallet Journal, 10 June 1938.
[13] The Ministry of Transport carried out a traffic census at 5,000 points throughout the UK during the week of August 12-18, 1936. MT44/14
[14] Aberdeen Press and Journal, September 1936.
[15] Wray wrote under the pseudonym “Kuklos.”
[16] Daily Herald, 12 September 1936.

